




What is a Company Organizational Chart?
A company organizational chart also called an org chart, organisation chart, or company structure diagram is a visual map of a business's internal structure. At its core, it answers three questions simultaneously:
- Who holds which role? Job titles, departments, and seniority levels
- Who reports to whom? Direct and indirect reporting relationships
- How is the company divided? By function, geography, product line, or project team
Lines are the language of org charts. Solid lines indicate direct (formal) reporting relationships that this person is accountable to that manager. Dotted lines indicate matrix or collaborative relationships, where an employee may work across two departments or report to a secondary authority on specific projects.
For employees, the chart answers "who is my boss and who owns what?" For external parties, banks, investors, regulators, and partners, it answers a deeper question: who controls this company, and is the management structure capable of delivering what the business claims it can?
Is a Company Org Chart Legally Required in Hong Kong?
No. The Companies Ordinance (Cap. 622) does not require Hong Kong companies to create, maintain, or publicly file an internal organizational chart.
That said, org charts become practically mandatory in the following situations:
[Table:1]
The short answer: you may not be legally required to have one, but most significant business milestones require one anyway.
Why Your Hong Kong Business Needs a Company Org Chart
A well-structured org chart is an operational tool, not an administrative formality. It solves four specific problems that grow more acute as your headcount increases.
Clarifies Roles and Accountability
An org chart makes accountability visible before a problem arises. It removes the ambiguity of "who owns this?" and replaces it with a documented, agreed record. When a client escalation happens, a deadline slips, or a compliance issue emerges, the org chart is the first reference point for tracing responsibility, not a painful conversation about who was supposed to handle it.
Streamlines Internal Communication
Unclear reporting lines create invisible friction. Employees do not know who to escalate issues to. Messages land in the wrong inbox. Approvals stall because no one is sure who holds sign-off authority. Decisions get made informally, then disputed formally.
A clear org chart specifies exactly who to contact for each type of decision and at what level of authority. It eliminates the "who should I ask?" loop that quietly consumes hours every week in poorly structured organisations.
Teams move faster, approvals follow predictable paths, and information reaches the right people without being filtered or delayed along the way.
Accelerates New Employee Onboarding
A new hire's first week is expensive and disorienting. They do not know the team structure, who the key contacts are, or how decisions flow through the organisation. Relying on verbal introductions and organic discovery means they spend weeks slowly piecing together a picture of how the business actually runs and they often get it wrong.
An org chart gives new employees immediate orientation: which unit they belong to, who their direct manager is, which departments they will collaborate with, and where they sit in the broader hierarchy.
Paired with a clear employment contract that defines role responsibilities and expectations, the org chart ensures a new hire understands their position and accountability structure from the moment they start.
Supports Cross-Departmental Coordination
An org chart establishes the standard pathways for collaboration. It shows which units are parallel, which operate under shared oversight, and where cross-departmental work needs a designated owner.
This clarity reduces the friction of "find the right person" workflows and creates a more predictable operational rhythm especially critical for Hong Kong businesses scaling through growth phases where team size and structure change frequently.
What Information Should a Company Org Chart Include?
A professional org chart is accurate, readable, and easy to update. These are the standard elements:
[Table:2]
Internal Version vs External Version
This distinction matters enormously, and many Hong Kong businesses miss it.
Internal version: Includes employee full names, photos, headcount, team sizes, and granular reporting structures. Used for day-to-day management, HR operations, and internal coordination. Accuracy and completeness are the priorities.
External version: Used for bank submissions, investor presentations, partner introductions, or government applications. Must remove or restrict personal data in compliance with Hong Kong's Personal Data (Privacy) Ordinance (PDPO). Do not include personal phone numbers, home addresses, or any sensitive employee information that falls outside the scope of the external purpose.
Handling Sensitive Ownership Information
When your org chart reflects the company's ownership structure, particularly when it includes ultimate beneficial owners (UBOs) or nominee directors, handle this information with care in external versions.
Banks require accurate UBO disclosure for AML screening, but these details should only be shared through secure and authorised channels rather than in an unsecured PDF attachment or a publicly accessible version of your chart. Instead, prepare a dedicated compliance version for banking and regulatory submissions.
5 Types of Company Organizational Charts
Different business sizes, industries, and growth stages call for different structural formats. Here is a quick comparison before the detail:
[Table:3]
1. Hierarchical Organizational Chart
The hierarchical org chart is the most widely used structure globally and the most intuitive. It follows a pyramid shape: the most senior leader (Chairman, CEO, or Managing Director) occupies the apex, with authority flowing downward through successive management layers to frontline employees.
At the top, you typically see 1–3 senior executives with formal titles: CEO, CFO, COO. Below that, the chart expands downward through senior management, department heads, team leads, and frontline staff. Solid lines connect each level, showing precisely who reports to whom and who holds final decision authority on any given matter.
Strengths: Accountability is unambiguous. The chain of command is clear. New employees understand their position immediately. The structure is well-suited to established Hong Kong businesses in manufacturing, financial services, professional services, and family-run enterprises where clear hierarchy is culturally expected and operationally appropriate. Compliance and audit teams find it easy to trace accountability lines, which simplifies regulatory examinations.
Weaknesses: As management layers multiply, information travels slowly and often arrives distorted. Frontline insights rarely reach senior leadership in time to influence decisions. Decision cycles extend. In fast-moving markets particularly in Hong Kong's competitive SME landscape, a rigid hierarchical structure can become a competitive liability, slowing responses to market shifts and customer needs.
2. Functional Organizational Chart
The functional org chart groups the company by specialist function. Similar expertise clusters together: Finance, Marketing, Human Resources, Operations, Sales, IT, Product. Each department concentrates the organisation's specialists in a given domain.
Each function is led by a department head, such as the Finance Director, Marketing Director, or Head of Operations, who reports directly to senior leadership. Beneath the department head, team leaders supervise individual contributors, creating a structured hierarchy within the department.
Strengths: Expertise is deep and concentrated. Finance staff develop shared knowledge and professional benchmarks. Marketing teams build strong creative and analytical muscles. Training is efficient because it is targeted. For Hong Kong SMEs where every headcount decision matters, the functional model ensures each domain operates at a high professional standard without the overhead of cross-functional management complexity.
Weaknesses: The persistent risk is departmental siloing. Teams optimise for their own metrics and lose visibility of the company's broader commercial goals. Cross-functional projects move slowly because no single function owns the end-to-end process. Customer problems that require coordination between, say, Operations and Finance often fall between functional cracks , causing delays that damage both efficiency and client relationships.
3. Matrix Organizational Chart
The matrix org chart introduces two simultaneous reporting axes: a vertical functional line (Finance, Marketing, Engineering) and a horizontal project or product line. An employee reports to both their functional department head and their project manager: the "two bosses" structure.
The chart is best visualised as a grid. Functional departments run vertically down the left. Projects or product lines run horizontally across the top. An employee at any intersection belongs to both dimensions and is accountable to both managers, with responsibilities that are explicitly defined for each relationship.
Matrix structures exist on a spectrum:
- Weak matrix: Functional managers retain dominant authority; project managers coordinate resources
- Balanced matrix: Authority is roughly shared between both dimensions
- Strong matrix: Project managers lead; functional departments support and supply expertise
Strengths: Human capital is maximised. A specialist contributes to multiple projects without the business recruiting duplicate roles. When a market opportunity or urgent project arises, cross-functional teams assemble quickly from existing resources.
Weaknesses: Competing instructions from two managers generate confusion and friction. Employees face elevated pressure from dual accountability, which increases attrition risk if managed poorly. Role ambiguity is common. The management overhead of coordinating across two authority axes is meaningfully higher than in simpler structures , and demands more experienced managers to operate without conflict.
4. Flat Organizational Chart
The flat (or horizontal) org chart compresses management layers to a minimum. In a true flat structure, the CEO or founder reports directly to most employees or self-managing team leads, with few or no middle managers mediating between them.
The chart looks wide and shallow. A small leadership layer sits at the top. A large array of employees or cross-functional teams sits directly below, often arranged as parallel peers. Communication is direct, such as company-wide meetings, instant messaging tools, and open physical or virtual working environments replace formal approval chains. Teams make decisions close to the work, without routing requests upward through management layers.
Strengths: Speed is the defining advantage. Decisions happen fast. New ideas move from proposal to execution without navigating approval queues. Employees enjoy high autonomy and develop a stronger sense of ownership and accountability. This is particularly appealing to Hong Kong's growing startup ecosystem, where speed-to-market is often the decisive competitive variable.
Weaknesses: Beyond a certain headcount typically 30 to 50 people, the flat structure deteriorates. A founder or CEO cannot effectively manage 40 direct reports without sacrificing quality of oversight. Resource allocation becomes inconsistent. Role conflicts escalate without clear hierarchy to resolve them.
5. Divisional Organizational Chart
The divisional org chart organises the company around discrete business units rather than specialist functions. Each division may be defined by a product line, geographic market, customer segment, or industry vertical. Critically, each division operates as a near-autonomous entity with its own Marketing, Finance, HR, Operations, and Sales capacity.
Strengths: Divisional autonomy enables rapid, market-specific responses to competitive pressure. Accountability is clean, each division's financial performance is directly measurable. The structure develops well-rounded general managers who build capability across all business functions, making it an effective talent development model for future senior leadership. For Hong Kong holding companies with multiple operating subsidiaries, the divisional structure maps naturally to legal entity boundaries.
Weaknesses: The cost of duplication is significant. Every division builds equivalent functional teams, multiplying headcount, technology costs, and administrative overhead across the group. Cross-divisional collaboration does not happen organically, it requires deliberate coordination mechanisms and often senior leadership intervention. Total group efficiency is lower than a unified functional model.
How to Create a Company Organizational Chart: Step-by-Step
Building an org chart that is accurate, professional, and fit for external submission requires three clearly defined phases.
Step 1: Preparation
Before drawing a single box, establish the foundation.
Clarify purpose and scope: An internal management chart looks very different from a bank submission or an investor presentation. Define upfront who will use this chart, for what purpose, and which layers of the business it needs to cover. A full-company chart for annual governance review is different from a departmental chart for a new team lead.
Gather current, accurate data: Contact HR, your administrative unit, or department heads directly.
Collect: department names, current hierarchy, direct reporting lines, headcount by team, formal job titles, and verified reporting paths. For Hong Kong private limited companies, director and shareholder information can be cross-referenced with the annual returns (NAR1) filed at the Companies Registry. This keeps your org chart consistent with your statutory filings , an important alignment when the chart is used in banking or compliance contexts.
Choose the right chart format: Match the type to your actual structure and the intended audience. A 12-person startup using a divisional chart will confuse every reviewer. A 500-person conglomerate running a flat chart will raise serious governance questions. Use the comparison table above as a starting point.
Select your tool: For simple, infrequently updated structures, Microsoft PowerPoint or Word is adequate. For complex, multi-layer organisations that change frequently:
- Lucidchart: cloud-based, real-time collaboration, shareable links
- Visio: enterprise-grade, deep Microsoft 365 integration
- Draw.io / diagrams.net: free, browser-based, exportable in multiple formats
- FigJam: collaborative, visually clean, design-friendly
- Canva: free org chart templates, drag-and-drop, accessible for non-designers
Step 2: Build the Chart
With your data and tool ready, build from the top down.
Start with the most senior position. The Chairman, CEO, or Managing Director occupies the apex of the chart. Include their formal title and name. This establishes the starting point for every reporting line below.
Add layers progressively.
- Each box displays two pieces of information: job title and the person's name.
- Maintain consistent box sizing, font, and alignment across every position at the same hierarchical level.
- Inconsistency at this level signals to external reviewers, banks, investors, auditors that the chart was assembled carelessly rather than as a deliberate governance document.
Mark reporting relationships with precision.
- Solid lines connect direct (formal) reporting relationships.
- Dotted lines indicate matrix or project-based relationships where a secondary accountability exists.
This distinction matters enormously when compliance teams are reading the chart specifically to understand control chains and ultimate accountability, particularly in AML-sensitive contexts.
Apply consistent colour coding by department. Choose a colour palette and apply it consistently: Finance in one colour, Marketing in another, Operations in a third.
Clear colour separation allows reviewers to identify department boundaries at a glance, without reading every label. Inconsistent or excessive colour use creates visual noise that undermines the chart's professional credibility.
Add essential header elements. Every chart submitted externally must include: company name, company logo, a descriptive title (e.g. "ABC Limited , Organisational Chart , Q2 2026"), and the last-updated date. Outdated org charts submitted to banks or compliance teams reliably trigger additional requests for clarification.
Step 3: Review, Revise, and Maintain
A draft chart is not a finished chart. Structured review is the step most businesses skip and the one that causes the most problems downstream.
Cross-check every line. Verify each reporting relationship, job title, and name against your source data. A single misplaced reporting line in a chart submitted during business bank account opening can trigger KYC escalations, delay approval timelines, or require entirely new documentation sets. Treat the org chart with the same accuracy standard you would apply to a legal filing.
Create separate internal and external versions. The internal version can include headcount data, employee photos, and internal contact details for day-to-day operational use. The external version for banks, investors, and regulators must be scrubbed of PDPO-protected personal data before distribution.
Establish a clear maintenance protocol. Org charts become liabilities the moment they fall out of date. Institute a clear rule: update the chart immediately following any significant personnel change, structural reorganisation, or material business event that affects the company's formation structure.
Assign one owner, typically the company secretary or an HR lead to maintain the chart, log each version with a date, and maintain an archive of previous versions. This is particularly important for maintaining alignment with your statutory filings at the Hong Kong Companies Registry, where your registered directors and shareholders must match what is documented in any compliance submission.
Aspire: The Business Account Built for Hong Kong SMEs
Aspire is a fully integrated financial operating platform designed specifically for modern Hong Kong businesses:
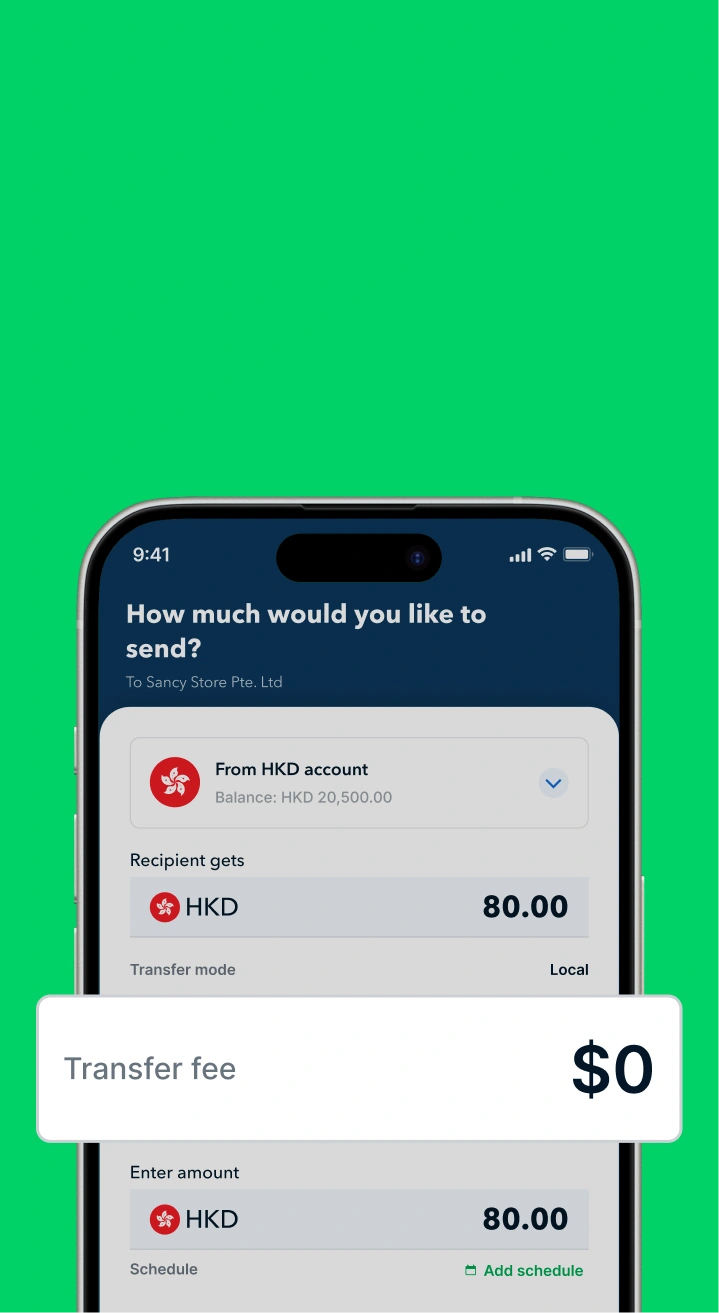
- Global reach, local simplicity. With Aspire multi-currency account, your business can send and receive payments across 130+ countries in 40+ currencies — with FX spreads from just 0.18%, up to 3x cheaper than a traditional bank wire. Where possible, Aspire routes transfers through local payment rails rather than multi-hop SWIFT chains, which means fewer intermediary fees, faster settlement, and less risk of funds being held at a correspondent bank for compliance review. This is particularly valuable when sending to markets like the UK, the US, or Southeast Asia, where local payment networks can significantly reduce costs and settlement times versus SWIFT.
- SWIFT transfers with instant confirmation. When SWIFT is the right rail for your payment, Aspire processes it with full SWIFT GPI tracking enabled. Once your transfer completes, you can download your payment confirmation instantly from the app — no calls to the bank, no admin fees, no waiting for an MT103 copy to be emailed over.
- Full financial control in one platform. Issue corporate cards with configurable spending limits, automate invoice and bill management, and sync every transaction with Xero or QuickBooks in real time. For Hong Kong SMEs managing payroll, free FPS and CHATS are both natively supported — ensuring domestic payments clear on time, every time.
- 1.2% unlimited cashback. Every eligible transaction on your Aspire corporate card earns 1.2% cashback. Combined with over USD 500,000 in partner rewards included with your account, Aspire turns your operating costs into working capital from day one.
Open your account free. Approved in as little as one business day. No branch visits, no stacks of paper forms, no waiting weeks for a relationship manager to call you back.
Frequently Asked Questions
What is the difference between a shareholder structure chart and a company org chart?
Both use tree or hierarchical diagrams, but they serve entirely different purposes.
A shareholder structure chart focuses on ownership and control. It shows who holds shares, at what percentage, through which holding vehicles or entities.
It maps the UBO chain , natural person → holding company → subsidiary and documents equity types (ordinary shares, preference shares) and ownership proportions.
Banks, lawyers, and tax advisors rely on this chart.
A company org chart (operational) focuses on management and workflow. It shows departments, job titles, reporting lines, and who is accountable to whom for operational decisions. HR teams, department heads, and new employees rely on this chart.
When you open a business account in Hong Kong, the compliance team typically requests both. The shareholder chart confirms beneficial ownership for AML purposes. The org chart confirms who controls day-to-day operations.
Does a small Hong Kong business need an org chart?
Practically, every Hong Kong company should have a basic org chart ready for two inevitable milestones: banking and fundraising. Banks expect it during account opening. Venture capital funds and angel investors include it in standard due diligence requests. An org chart, even a simple one, signals that the business is structured to execute its stated strategy. Without one, you signal the opposite.
What should a Hong Kong limited company's org chart include for banking purposes?
For AML and KYC compliance, banks typically expect:
- Ultimate Beneficial Owners (UBOs): Names, passport details, and ownership percentages for all beneficial owners holding 10% or more
- Directors and senior management: All registered and shadow directors, with their formal roles
- Subsidiary and holding structure: If the company is part of a group, each layer of the structure with ownership percentages at each level
- Nominee director disclosure: If nominee directors are in place, the underlying beneficial controller must be clearly identified and documented separately
Cross-reference your org chart with your Companies Registry filings to ensure consistency. Any discrepancy between the two will trigger additional documentation requests and delay account opening.





.webp)