


Activation Rate (E-commerce, SaaS)
The percentage of new users who perform a key action within a given period. This metric allows businesses to track how successful their onboarding process is and if they attract the right customers.

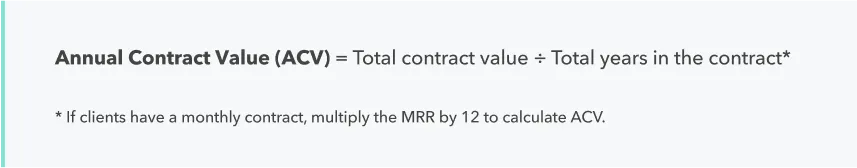
ACV: Annual Contract Value (Sales, SaaS)
The average yearly revenue for one customer contract (usually excluding any one-off fees).
This metric is helpful compared to other metrics like Annual Recurring Revenue or Customer Acquisition Cost. It shows how long it takes to win back the money needed to acquire a new customer. Or how the value of one customer compares to others.
ARR: Annual Recurring Revenue (SaaS, Sales, Finance)
The predictable revenue generated by a SaaS or subscription company from all its active subscriptions normalised for a single calendar year.

To calculate ARR, you must include recurring revenue from add-ons and plan upgrades. But you must also take into account downgrades and churned customers.
Note: ARR can’t be used for monthly contracts even though the total subscription time lasts for more than a year. It is only for contracts that last at least 12 months.
Annual Run Rate (SaaS, Sales, Finance)
A projection of future total revenue based on past, short-term revenue, assuming that current conditions continue. (Also called Revenue Run Rate or Sales Run Rate)
Annual run rates are typically calculated based on MRR or quarterly revenue. This is a handy metric to calculate future revenue, but it doesn’t consider seasonality or one-off payments.

AOV: Average Order Value (E-commerce, Sales)
The average amount of money a customer spends on a single order from an e-commerce site over a given time.

This metric is useful in helping retailers understand the purchasing behaviours of their customers. Over time, the goal for e-commerce business owners is to increase the AOV for each customer and lower CAC.
ARPU: Average Revenue Per User (SaaS, Sales)
The average amount of money a company can expect to generate from one subscriber, user or customer over a specified period. Also called Average Revenue Per Account (ARPA).

This metric is used to compare different acquisition channels within a company or to compare the potential of companies.
Average Purchase Value (Sales)
The average sales value of a company’s transactions.
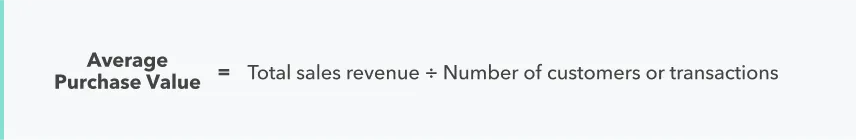
Depending on the business model, companies can calculate the Average Purchase Value based on the annual, monthly, weekly, daily, or contractual value.
Average Session Duration (Product Performance, SEO)
The average session length of users on a website. A website session starts as soon as a visitor lands on your website and ends when they leave or remain inactive for some time.

Billings (Finance)
The amount on invoices due for payment according to the terms in a contract.
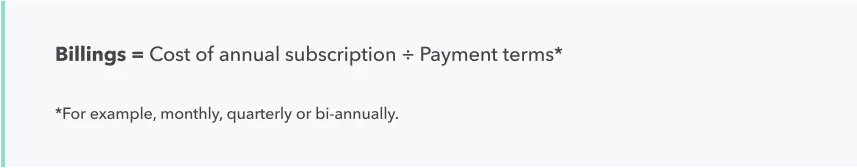
Billings can happen once or in different installments depending on the type of contract. This metric shows how much cash you will collect in a certain period. Hence, it gives insight into a start-ups short-term financial health.
Bookings (Finance)
The total value of all contracts over one year, including one-time fees.

A booking occurs when a customer commits to paying for a service. It converts into revenue once the service is delivered. Bookings are important to predict a start-up’s future revenue.
Bounce rate (SEO)
The percentage of visitors who enter a website and leave after only viewing one page.

When a visitor bounces from a website, it may indicate that the content doesn’t meet your user’s expectations. Some contributing factors include a slow page-loading time, poor website navigation, technical errors or even misleading information.
Burn Rate (Finance)
The rate at which a company is spending its start-up capital before generating any form of positive cash flow or profit.

The burn rate is essential to calculate a start-up’s financial runway. It allows you to measure how much time the company has left to become profitable or find more funding.
Cart Abandonment Rate (E-commerce)
The percentage of online users or shoppers who add items to their virtual shopping cart but abandon it before completing the transaction.

High cart abandonment rates indicate that online shoppers do not want to go through with their purchases because of expensive shipping costs, excessive pop-up ads, complicated checkout processes, and limited payment options.
Cash Runway (Finance)
The amount of time a company has to become profitable before they run out of cash.

Cash runway is a vital metric to track growth and profitability. A shrinking runway means companies need to work towards a more profitable model.
To calculate cash runway, start-ups usually don’t include team cash (used to pay employees) and founder cash.
Customer Churn Rate (Product Performance)
The rate at which users, customers or subscribers stop using a service over a specified period. Also called Attrition Rate.

Churn is a good indicator of customer satisfaction and helps you assess the effectiveness of your customer retention efforts. A reasonable churn rate depends on the size, industry and age of your company. Rates above 20%, however, are worrying.
Conversion Rate (Marketing)
The percentage of users that have completed the desired action that marketers set out for their company. Depending on your business goals, these actions include buying your product or sharing your website through social media.

CTR: Click-through Rate (SEO)
The number of clicks on a specific link per number of impressions.

The CTR may effectively measure the immediate response of a company’s marketing assets, but it doesn’t immediately equate to a high conversion rate. This simply indicates how well your listings, ads and keywords are performing based on the number of clicks.
COGS: Cost of Goods Sold (Finance)
The sum of all the costs needed to produce a good. Costs included in the calculation are labour, raw materials and amortisation. Sales, marketing and distribution costs are typically excluded. (Also called Cost of Sales)
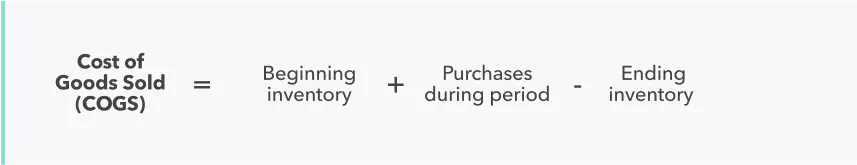
A higher COGS results in lower margins. While this may be beneficial for tax purposes, net profits for shareholders will be lower.
CPL: Cost Per Lead (Marketing, Sales)
A measure that indicates how much your business spends per new lead.

Comparing the cost per lead for different channels and campaigns shows you where to focus your efforts in the future.
Current Ratio (Finance)
A financial performance measure that evaluates the short-term liquidity or working capital of an organisation. Comparing current assets with current liabilities shows a company’s ability to pay off its debts once they are due.

Companies are advised to maintain a 2:1 ratio to better meet their financial obligations. But smaller businesses that need a lot of liquidity may not be able to maintain those numbers.
CAC: Customer Acquisition Cost (Marketing)
The cost and resources needed to acquire a new customer over a specific period.

CAC is an important metric to know how effective marketing budgeting is. Potential investors will also refer to a company’s CAC to examine its profitability before an investment.
CAC Payback Period (Marketing)
The time it takes to earn back the money spent on acquiring a new customer.

Monitoring this metric is essential to understand how long it takes before a new customer becomes profitable for your business. If a customer churns before reaching the payback period, this customer costs you money.
CLV: Customer Lifetime Value (SaaS, Sales)
The average revenue a company expects to generate from a customer throughout their relationship.

CLV shows how healthy your customer base is and how likely your company will grow in the future. Business experts say that your CLV should be at least three times greater than your CAC.
CMGR: Compound Monthly Growth Rate (Finance)
The average month-over-month growth for a period of six to eighteen months. Over longer periods, start-ups also calculate Compound Annual Growth Rates (CAGR).
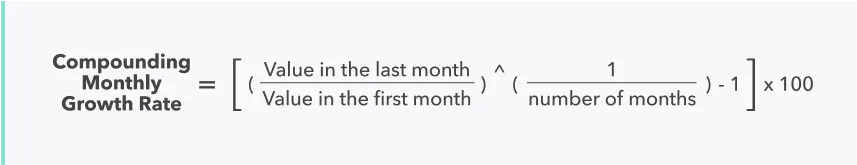
This metric shows the average growth over a past period or predicts future development if conditions stay the same. It’s helpful to compare the average growth of companies.
Concentration Risk (Finance)
The potential for loss in an investment portfolio when any single or group of exposures threaten the ability of the institution to continue operating.

Concentration risk often occurs when an organisation is too dependent on a single market to drive revenue, which causes uneven distribution of exposures to different sectors or products.
CRC: Customer Retention Cost (Product Performance, Finance)
The total cost of retaining an existing customer. This includes the costs involved with customer engagement, success, service, engagement, marketing, training and other tools to retain customers.

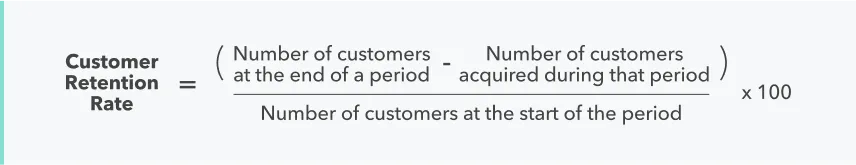
Customer Retention Rate (Product Performance)
A company’s ability to retain customers or the percentage of existing customers who stay with the business after a given period.
CSAT: Customer Satisfaction Score (Product Performance)
CSAT measures how satisfied customers are with a company’s product or service.
CSAT scores from a customer survey are based on scores from 1 to 5 (1 being ‘Very Unsatisfied’ and 5 being ‘Very Satisfied”). The scores are then tallied based on the formula below and expressed as a percentage scale.

It is important to note that it works best to measure an individual customer’s satisfaction levels instead of larger groups.
DAU: Daily Active Users (Product Performance)
The total number of users who actively engage with a web or mobile product daily. Users must have viewed, opened or used the product to be considered active users.

As an essential measure of engagement, the DAU metric helps business owners measure various things like user behaviour and product growth rate.
Debt-to-Equity Ratio (Finance)
The total amount of debt and financial liabilities a business has compared to the total shareholder’s equity.

The goal is a low debt-to-equity ratio since debt is risky in business. If an organisation has a high debt-to-equity ratio, it funds its growth by accumulating debt.
Deferred Revenue (Finance)
A payment from a customer for future goods and services that have not yet been delivered or completed. (Also known as Unearned Revenue.)

This amount is often considered a liability as the payment is only made in advance and doesn't count as revenue.
Direct Traffic (SEO)
Website visits from people typing your website URL directly into your browser or through a browser bookmark. Apart from direct entries, most analytic tools like Google Analytics categorise any unrecognisable traffic source as direct traffic.
Downgrade Monthly Recurring Revenue (Finance, SaaS, Sales)
The reduction in monthly recurring revenue because existing subscribers pay less than they did the previous month.

End Action Rate (Marketing)
The End Action Rate determines the effectiveness of marketing campaigns based on the last action taken by a website visitor. (Also known as conversion activity.)

Engagement (Social Media)
Engagement is the number of people who have interacted with your content. Actions like shares, likes and comments count as engagement.
Expenses (Finance)
The operational costs of conducting business to generate revenue.
Typical business expenses include rent, utilities, payroll, bank fees, software subscriptions and equipment.
FCF: Free Cash Flow (Finance)
Free Cash Flow reveals the cash a company has at its disposal after considering cash outflows towards operations and capital assets.

Gross Churn Rate (Finance)
The percentage of recurring revenue lost during a period due to cancellations and downgrades made by existing customers.
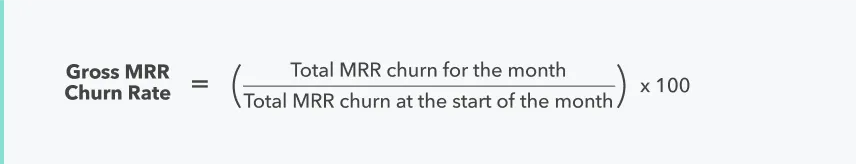
While this metric can be expressed annually, most businesses calculate a monthly churn rate.
GMV: Gross Merchandise Value (Finance)
The total value of goods a company sells over a certain period, usually quarterly or yearly. GMV is calculated before accrued expenses, such as advertising/marketing costs, delivery costs, discounts and returns.
Gross Profit (Finance, Sales)
The company’s profit after deducting the costs used to cover the manufacturing and distribution of its goods and services.

Gross Profit Margin (Finance, Sales)
An analytical measure determining a company’s profitability or percentage of sales revenue that exceeds the cost of goods sold (COGS).

Mind that the gross profit margin shows the amount of profit made from a single product or service and not of the entire organisation.
Income (Finance, Sales)
The money a company receives in exchange for a product, service or capital investment.
Incremental Sales (Marketing, Sales)
The extra sales made thanks to a marketing or sales campaign.

Impressions (Social Media)
The number of times your content is displayed regardless of whether it was clicked on or not. If the same person sees the same content twice, it counts as two impressions.
IRR: Internal Rate of Return (Product Performance)
The annual rate of growth of an investment, expenditure or project.

The IRR helps investors predict the profitability of an investment. Similarly, it’s a good indicator of an investment fund’s track record.
Keyword Rankings (SEO)
The position of your webpage on the search results pages for a particular search query.
Lead Conversion Rate (Marketing)
The percentage of website visitors that end up converting to leads.

Marketshare
The percentage of sales in an industry generated by one particular company.

Marketshare indicates the size of a company in a market.


.webp)


.webp)